Welcome
BGFit provides a web-based unified platform, where a rich set of dynamic models can be fitted to experimental time-series data, further allowing to efficiently manage the results in a structured and hierarchical way.
The data managing system allows to organize projects, experiments and measurements data and also to define teams with different editing and viewing permission.
Several dynamic and algebraic models are already implemented, such as Polynomial Regression, Gompertz, Baranyi, Logistic and Live Cell Fraction models and the user can add easily new models thus expanding current ones.
Publications, discussing results obtained with the help of BGFit, are asked to reference the following paper and webpage:
Veríssimo, A., Paixão, L., Neves, A. R. & Vinga, S. BGFit: management and automated fitting of biological growth curves. BMC Bioinformatics 14, 283 (2013).
First action
Projects
Start using this application
by adding data
Models
View existing Models
(or create new ones)
Public projects
View published models Projects
Documentation
BGFit documentation
Tips
Dictionary for BGFit:
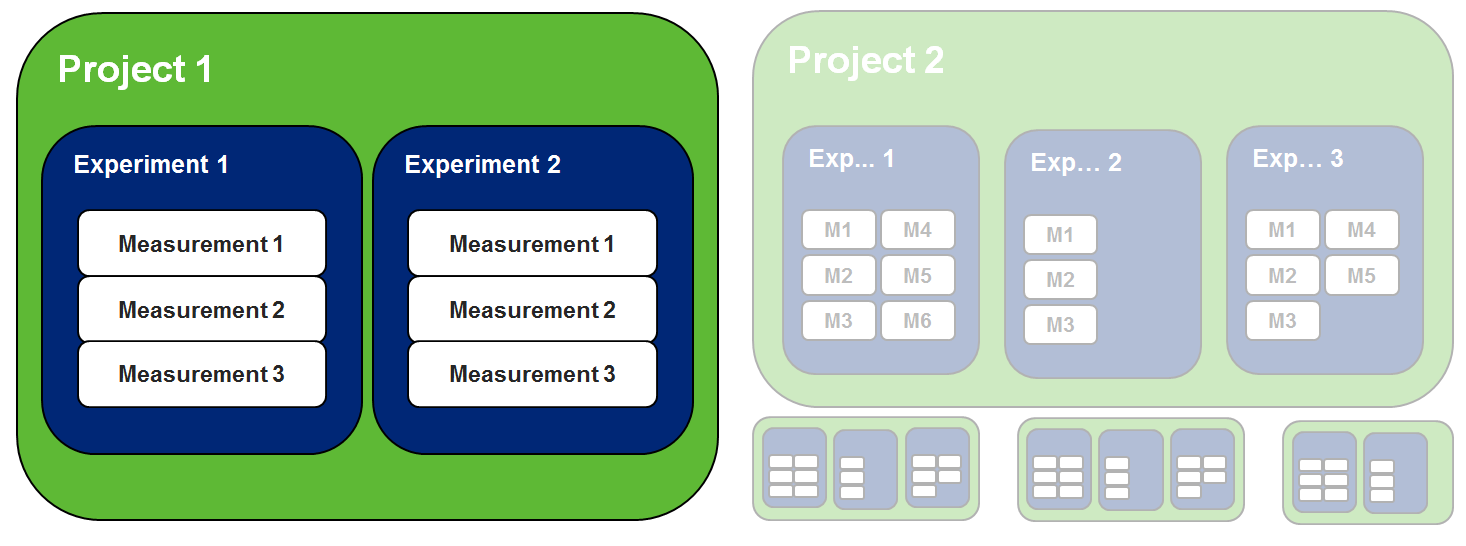
- Project
- A top-level layer where permissions and public scope of the data is defined
(see in "Manage data" topic below) - Experiment
- Folder that aggregates different collections of data, which can also be modeled
- Measurement
- 3-dimensional data that can also be annotaded. Each measurement can be modeled.
- Model
- Model extension that is available in BGFIT. This can be a dynamic model that is defined using a diferential or algebraic equation.
- Proxy Model
- These are implementation of models that are associated with the set of data that will model this set (either measurement or experiment)
Manage data: (structure for data-management)
Data management is divided in three layers: project (top-level folder) -> experiment (folder) -> measurement (actual data)
- Project: Top-level folder where permissions and other properties are set
- Experiment: Folder to organize and aggregate data by typology
- Measurement: Actual data
Navigation:
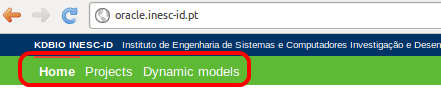
The top toolbar has all the navigation links in this web application. There are three static links that are common throught the application (Home & Project & Model)
The print below shows these two static links
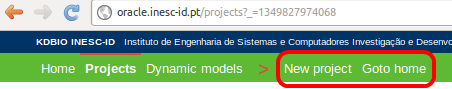
Additionnaly, there are some contextual actions, depending on the active page, which can be accessed next to the > symbol in orange, as shown in the image below